




1 System Overview
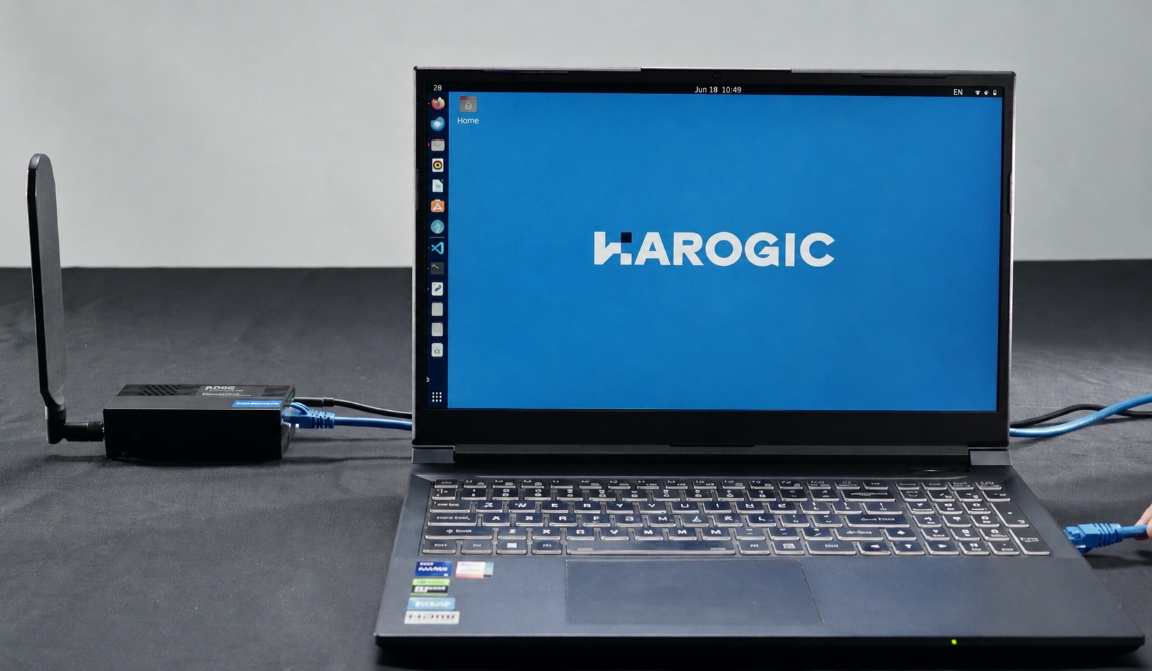
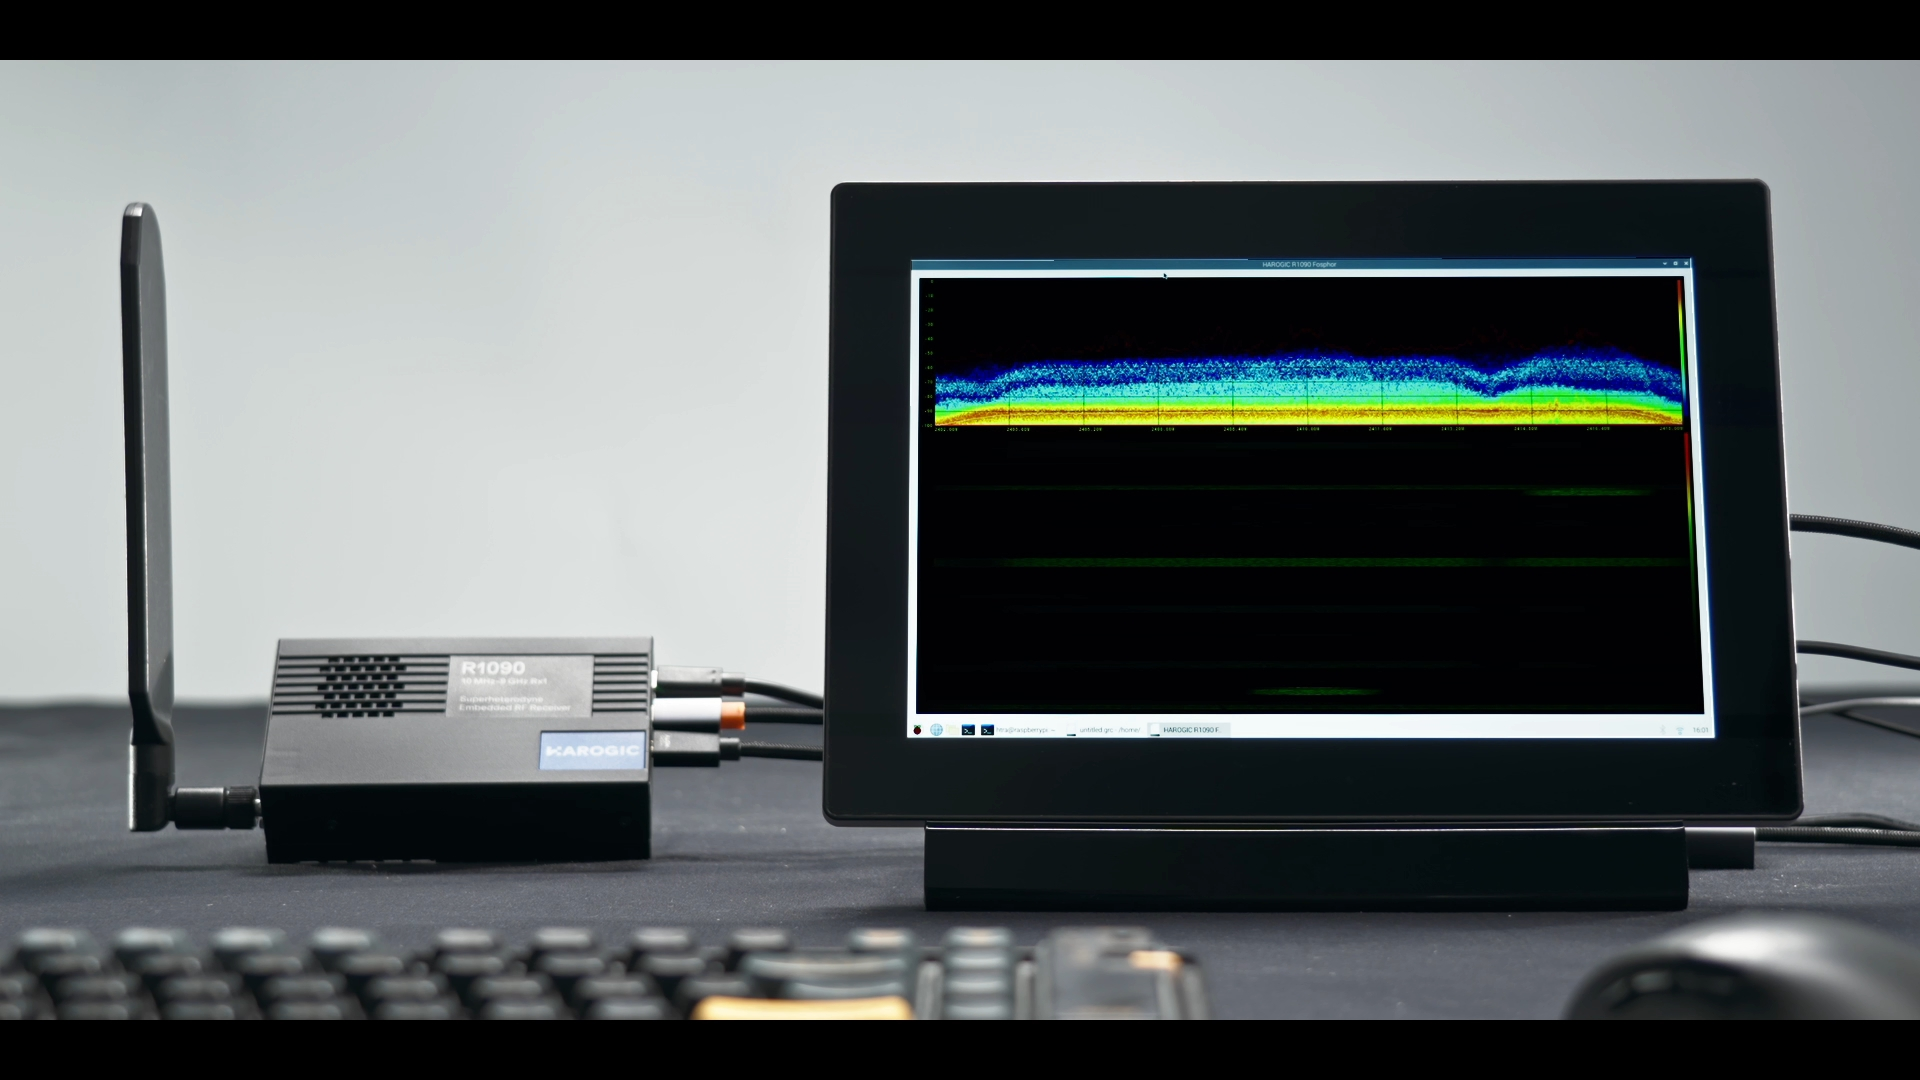
The R1090 Fosphor real-time spectrum visualization demo system consists of an R1090 series receiver, a host computer with Gigabit Ethernet, GNU Radio, the HAROGIC HTRA IQ Source block, and gr-fosphor. It demonstrates RF IQ acquisition, GNU Radio flowgraph processing, and real-time spectrum visualization.
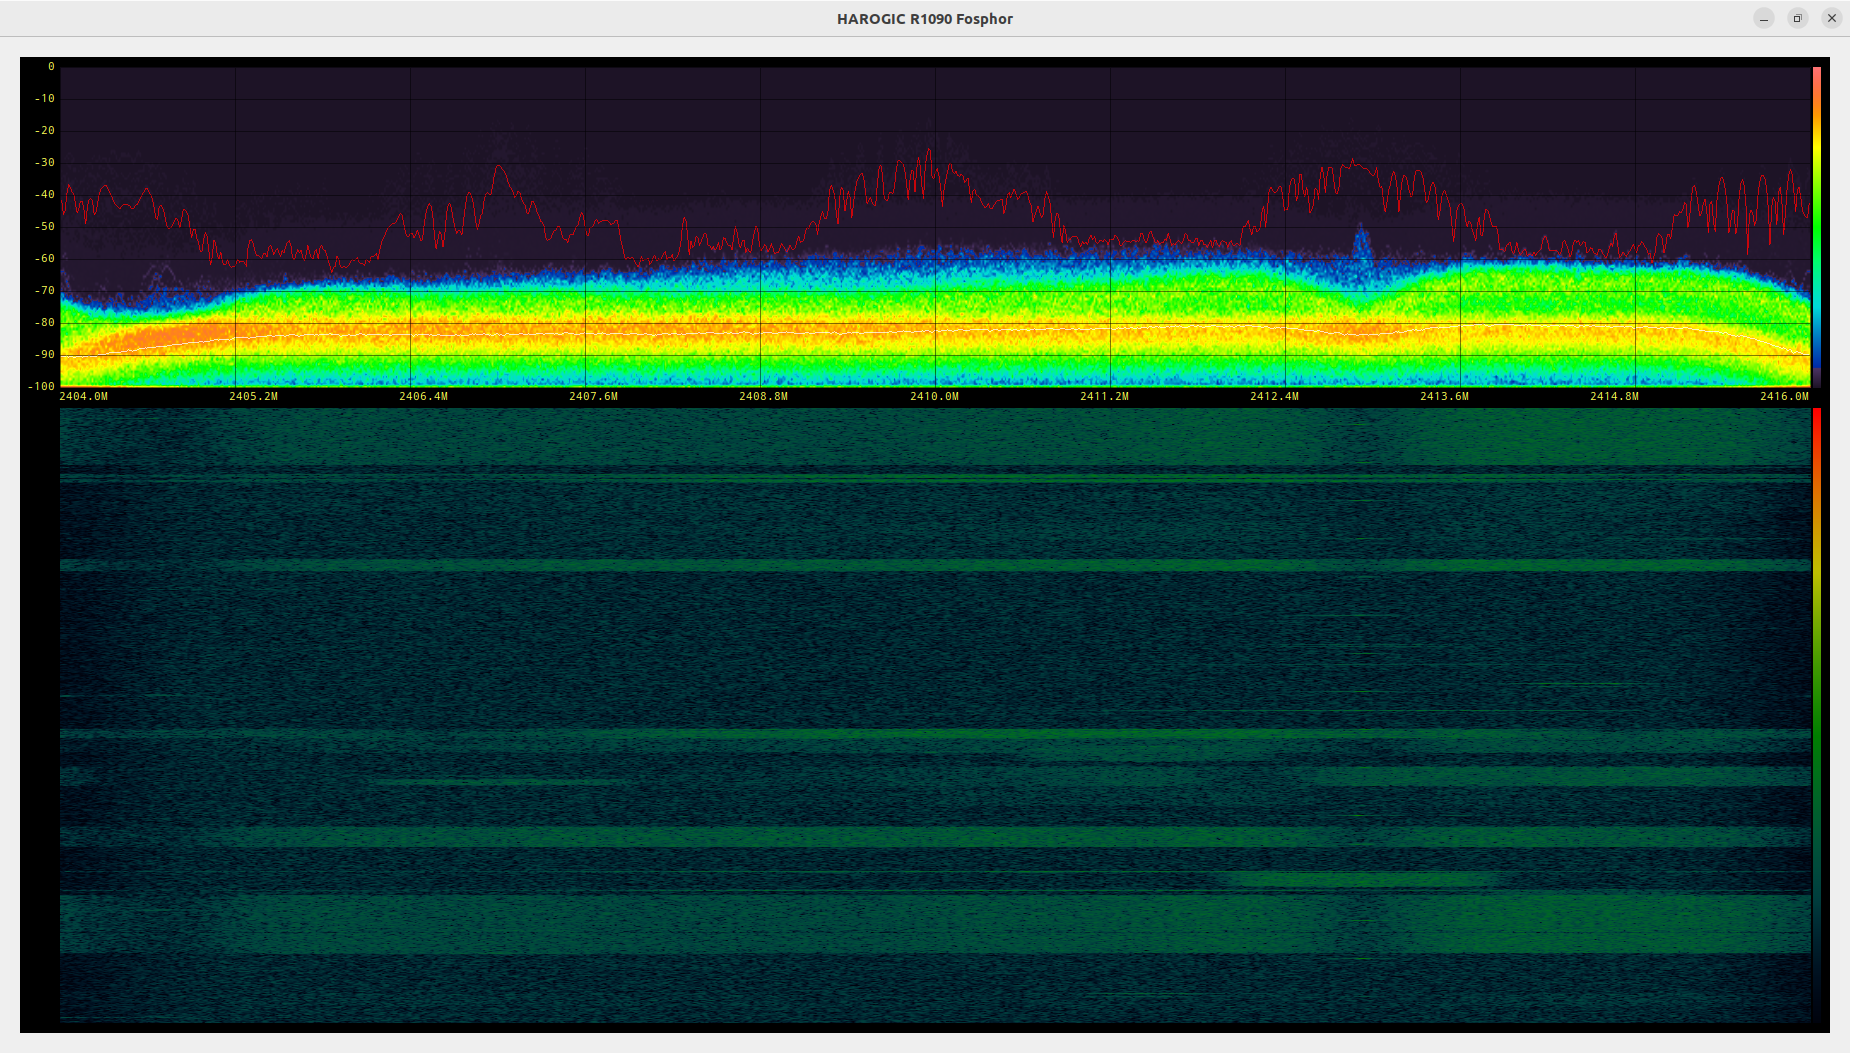
The R1090 connects to the host computer over Ethernet and streams complex IQ data via 1GbE. GNU Radio builds and connects the signal-processing flowgraph, while gr-fosphor presents a continuously updated spectrum, spectrum-density view, and waterfall display to show how signals evolve over time. For each demonstration, the center frequency, sample rate, decimation factor, gain, and/or reference level can be adjusted to suit the receiver model and signal characteristics.
The system also demonstrates the R1090's embedded Raspberry Pi 5 platform. It runs GNU Radio flowgraphs independently and outputs the display over HDMI for spectrum visualization and analysis.
2 Demo Images
3 Technical Highlights
- Apply an RF signal from an antenna or signal generator to the R1090.
- The R1090 tunes the selected band and streams complex IQ data to GNU Radio over 1GbE.
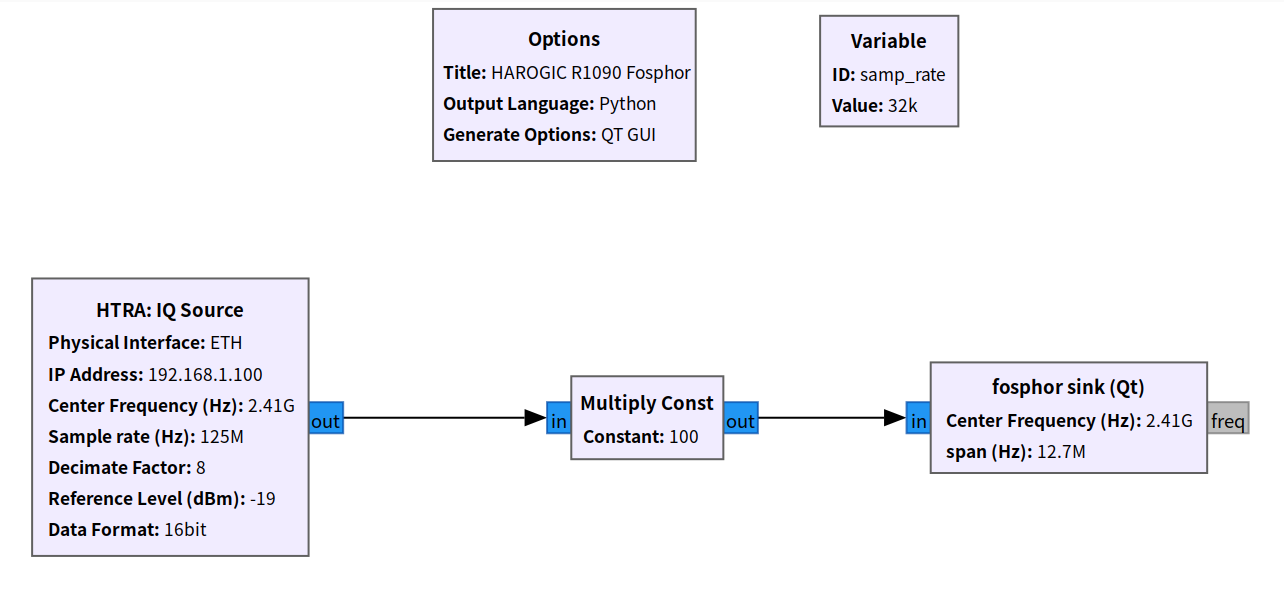
- The HAROGIC HTRA IQ Source block feeds R1090 IQ data into the GNU Radio flowgraph.
- The Fosphor Sink visualizes the IQ stream as spectrum, spectrum-density, and waterfall views for continuous, short-duration, and intermittent signals.
- A Multiply Const block scales the IQ amplitude to show the R1090's low noise floor. The scaling factor can be adjusted for the IQ format and demo configuration.
4 Demo and Development Scenarios
This demo showcases R1090 IQ acquisition and streaming, GNU Radio flowgraph design, and Fosphor visualization. Spectrum-density and waterfall views help reveal short-duration, recurring, or intermittent signals.
With R1090 hardware and GNU Radio, Fosphor, or SAStudio4, developers can build custom spectrum displays, process IQ data, capture laboratory data, and prototype algorithms.
This is a functional demo and secondary-development reference, not a standards-compliant real-time spectrum analyzer. Fosphor provides RTSA-style real-time spectrum visualization from streaming IQ data. For professional spectrum analysis, interference investigation, and formal measurements, use HAROGIC SAStudio4.
5 System Requirements
| Hardware | Software |
|---|---|
| R1090 Series Receiver | GNU Radio 3.9 or later |
| 1GbE Host Computer | HTRA GNU Radio Module |
| Antenna or RF Source | gr-fosphor |
| 50 Ω RF Cable and Attenuators | OpenCL/OpenGL Runtime |
| Gigabit Ethernet Cable | R1090 Fosphor Flowgraph |
6 References
- gr-fosphor Project
- GNU Radio Official Website
- HAROGIC Documentation: R1000 Series User Manual and Programming Guide
- HAROGIC GitHub Resources
 Back to Cooperation