


RF Signal Mapping and Geolocation Using HAROGIC Mapping Mode
04 / 14 2026
1. What Is RF Signal Mapping and Why Does It Matter?
As RF environments become more dense and complex, engineers, regulators, and field teams face increasing challenges in identifying, analysing, and locating signals in the real world. Traditional spectrum analysers provide strong visibility in the frequency domain, but they do not show where signals are distributed geographically. As a result, troubleshooting can take longer, field operations can become less efficient, and overall operational costs may increase.
RF signal mapping helps solve this problem by linking spectrum measurement data with geographical location. With the introduction of Mapping Mode in the SAStudio4 software platform, HAROGIC enables users to visualize RF signals over maps in real time by combining spectrum data with GNSS positioning. This allows a conventional spectrum analyzer to be used as a practical geospatial RF analysis tool that provides faster and more actionable insights in the field.
Another important advantage is accessibility. Mapping Mode is available as a free upgrade in SAStudio4 Version V3.55.35 and above, removing the need for expensive third-party mapping software or additional licensing. This lowers the cost of entry for users who need RF mapping capability while increasing the value of existing HAROGIC systems.
2. How HAROGIC Mapping Mode Works
HAROGIC Mapping Mode is designed to support flexible and scalable deployment across different hardware platforms. A typical setup includes a HAROGIC USB spectrum analyzer from the SA series, SAStudio4 software, a GNSS receiver for positioning, a host computing platform, and an antenna selected according to the application.
One of the key strengths of the system is its compatibility with low-power embedded platforms such as Raspberry Pi running a 64-bit operating system. This makes it possible to build compact, portable, and energy-efficient RF mapping solutions for field use without relying on bulky or power-hungry equipment. The lower system cost and smaller footprint also make the solution attractive for large-scale or mobile deployment.
This flexibility also supports drone-based RF mapping. By combining a USB spectrum analyzer, a Raspberry Pi, and a GNSS module, users can build a lightweight system for installation on an unmanned aerial vehicle (UAV) to perform real-time signal mapping over large areas. Compared with traditional airborne RF survey systems, this approach offers a more cost-effective and less complex solution. Typical applications include cellular coverage verification, interference detection, spectrum surveillance, and security-related missions.
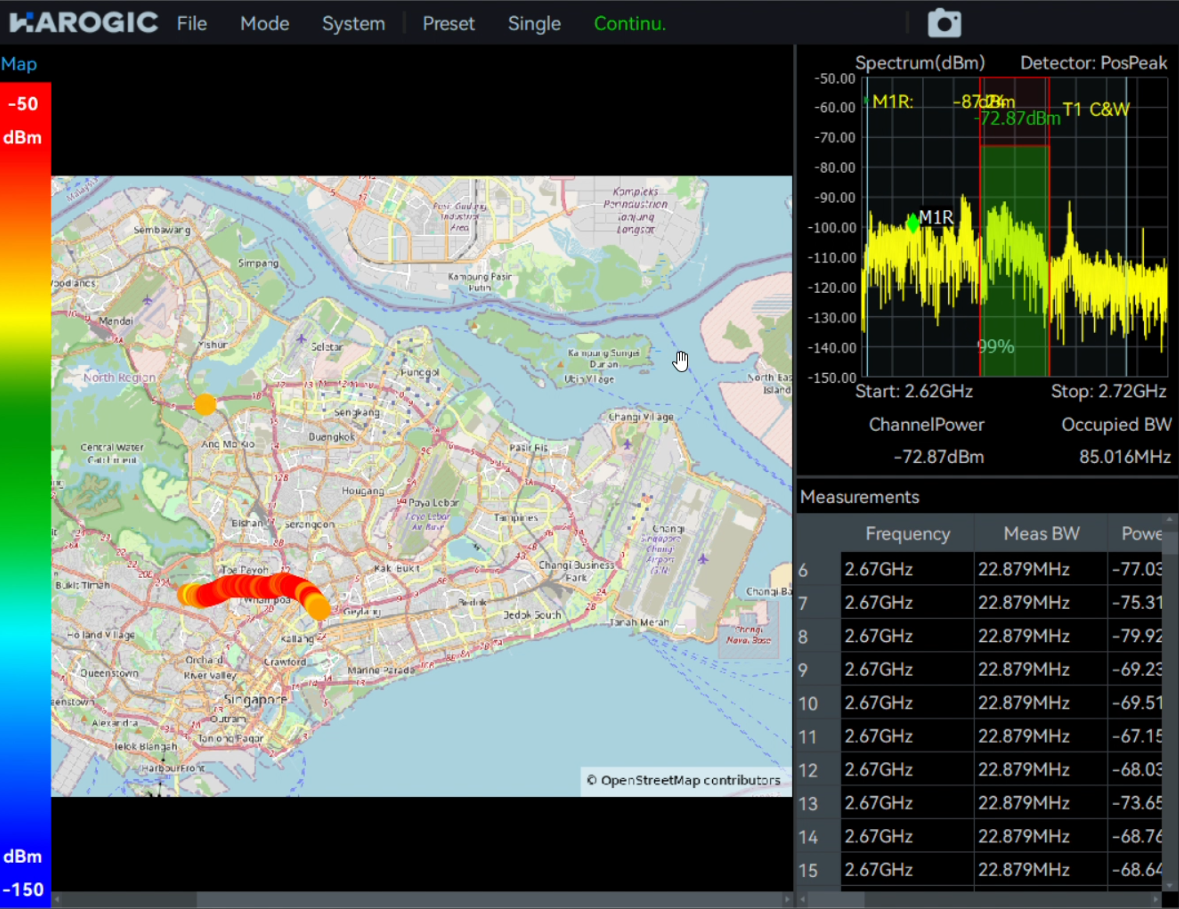
Geographical Cellular Signal Mapping
3. RF Mapping Software Interface and Visualization Capabilities
The Mapping Mode graphical user interface is designed to provide both intuitive operation and strong analytical capability. It allows users to overlay RF measurement data on different map sources while maintaining flexible control over how measurement points are collected and displayed.
The software supports multiple map formats, including OpenStreetMap images in PNG format and custom maps such as indoor floor plans or site drawings. This makes the system suitable for both outdoor and indoor RF mapping applications, including in-building wireless analysis.
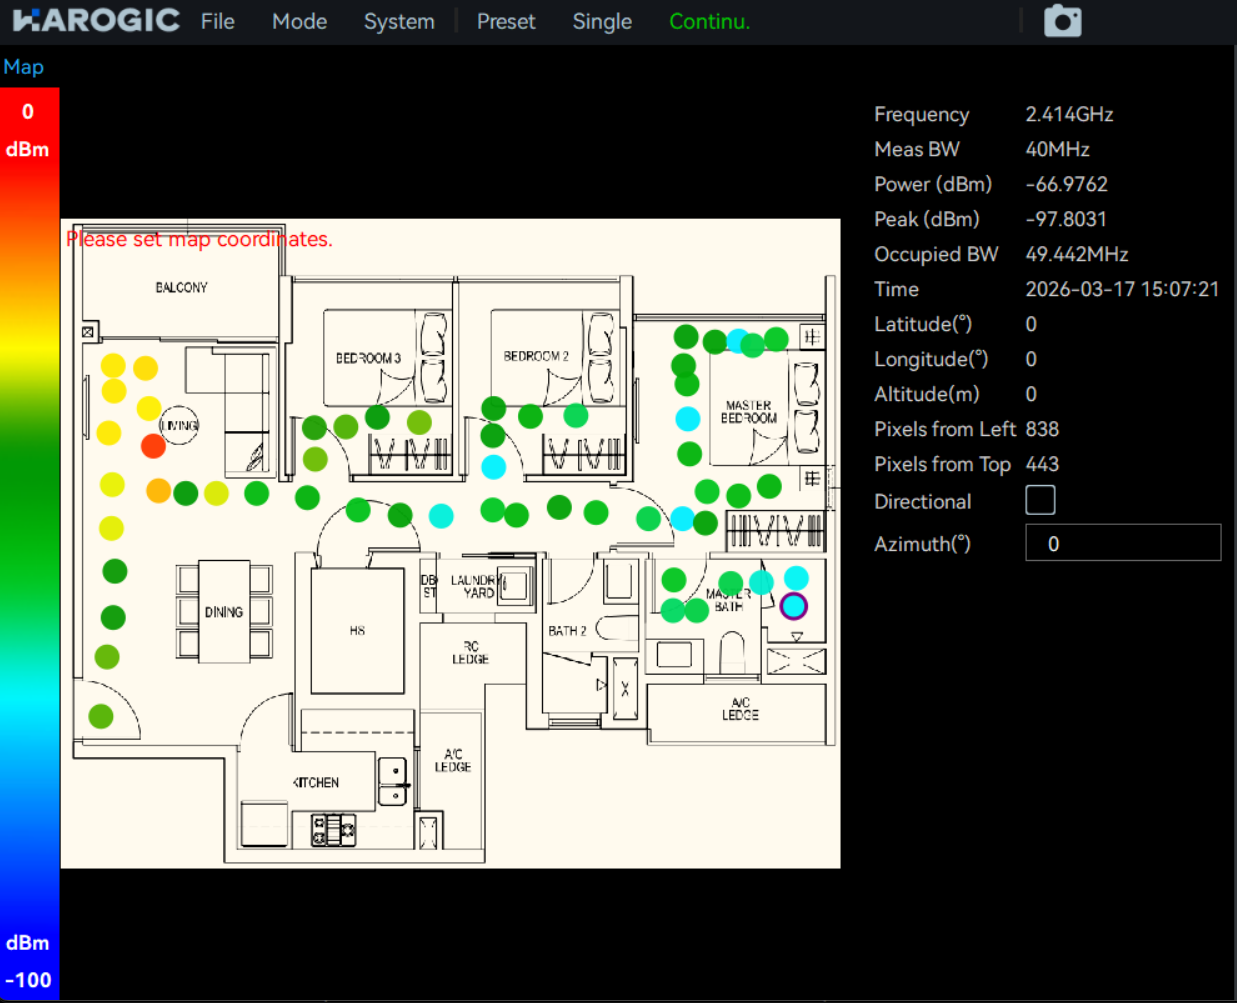
Indoor Home WiFi Signal Mapping
A major advantage of Mapping Mode is its ability to support large geographical areas while maintaining smooth navigation and real-time updates. Users can zoom, pan, and follow measurement paths easily, while the software continuously updates RF information across the mapped area.
At the centre of the interface is the heat map rendering engine, which provides a visual representation of signal strength distribution. In addition, the GUI integrates key RF measurement parameters such as channel power, occupied bandwidth, spectrum traces, and RSSI indicators directly within the mapping view. By presenting spatial and spectral information together, the interface helps improve analysis efficiency and makes it easier to understand signal behaviour in real environments.
4. RF Interference Localization Using Triangulation
In addition to real-time RF visualization, HAROGIC Mapping Mode provides a practical method for locating interference sources through triangulation. This technique uses measurements taken from multiple positions together with directional signal information to estimate the location of a signal source.
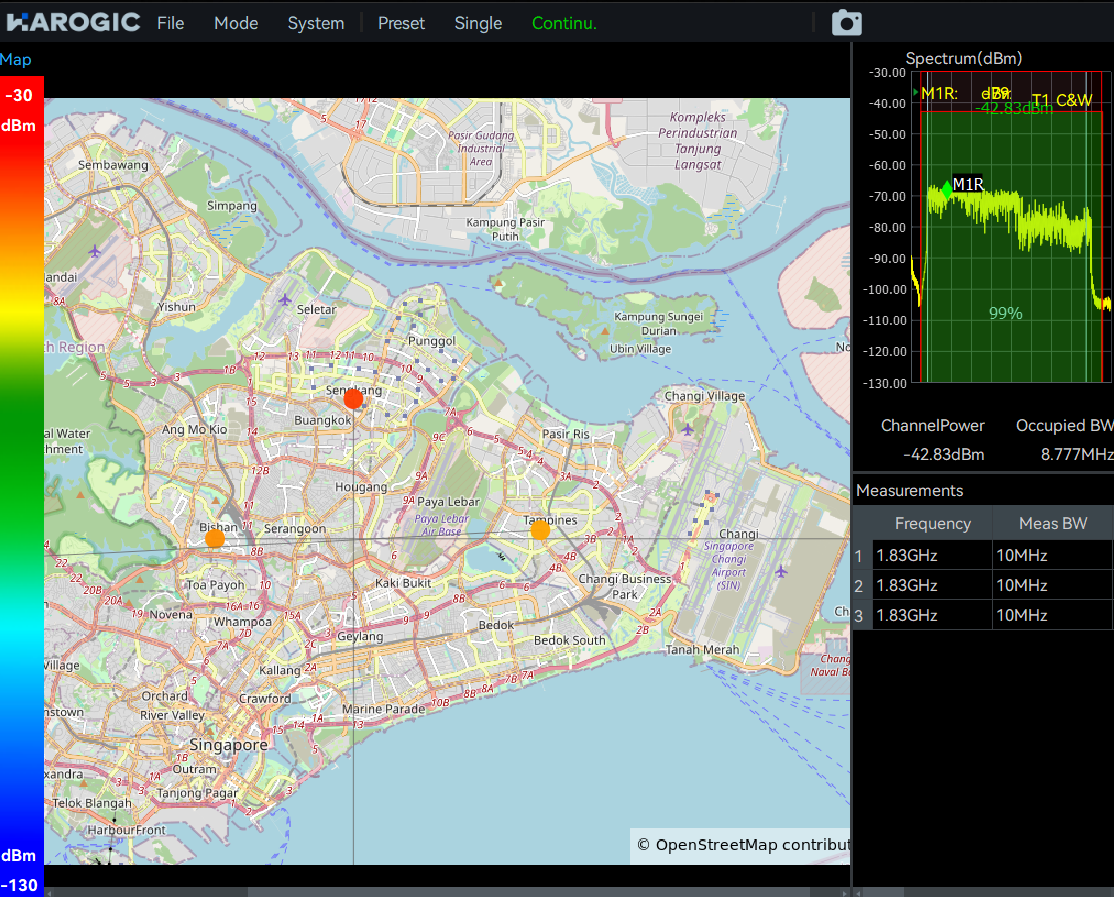
Interference Hunting with Triangulation Method
In a typical workflow, the user moves to three or more different locations and determines the direction of maximum signal strength at each point. These directions are then drawn as lines on the map within the Mapping Mode interface. The point where the lines intersect indicates the likely position of the interference source, allowing faster and more accurate localization in the field.
To support this application, HAROGIC offers the HDA-100 directional antenna, which covers a wide frequency range from 500 MHz to 10 GHz and includes a switchable pre-amplifier for improved sensitivity. Its wideband design allows the antenna to be used across multiple applications without frequent hardware changes.
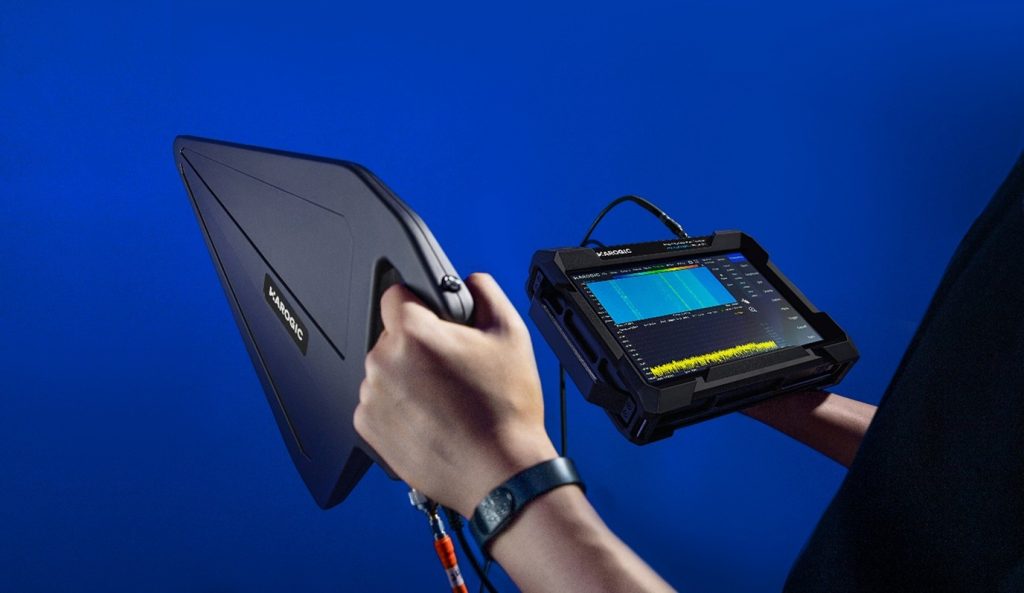
HAROGIC HDA-100 Directional Antenna
 Back to Cooperation


